 |
TRIGONOMETRY IT LESSON 1 - GRAPHS OF SINE FUNCTIONS
1
(SEC 3 ADDITIONAL MATHEMATICS)
Software: JavaSketchpad and LiveMath
(previously known as MathView)
Thinking Skills: Induction
and Deduction
At the end of the lesson, the students should be able to:
(1) sketch the graphs of sine functions of the form y = a sin x + c,
(2) describe the characteristics of the graphs of sine functions.
A. GRAPHS OF SINE FUNCTIONS: y = sin x
Note: This section should preferably be taught by the teacher.
JavaSketchpad cannot support this
sketch, so you have to open the GSP file (IT3AMTrigoSineGraph1.gsp)
using the Geometer's
Sketchpad software which has a free evaluation version. Click on
the hyperlink above and choose the option "Open it" instead of "Save it
to disk". If you are using GSP for the first time,
a dialogue box "Open With" will appear. If you don't know what to do, click
here. The diagram below is just a non-interactive picture of the
sketch.
|
|
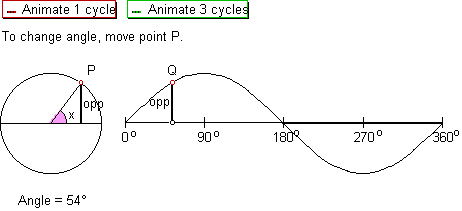
| 1. | The first sketch (IT3AMTrigoSineGraph1.gsp) shows a triangle inside a circle of radius one unit. The side of the triangle opposite the pink-coloured angle x is indicated by a thick blue line labelled "opp". [The diagram above shows a thick black line instead.] |
| 2. | As the vertex P of the triangle rotates round the circle, the point Q will trace out the sine curve. Double-click the red button "Animate 1 cycle" and observe how both the thick blue lines "opp" vary their lengths accordingly. Click anywhere to stop. |
| 3. | Double-click the green button "Animate 3 cycles". |
| Question 1: | What do you notice about the lengths of both the thick
blue lines labelled "opp"?
|
| Question 2: | Explain how the sine curve is related to the length of the thick blue
line "opp".
|
B. GRAPHS OF SINE FUNCTIONS OF THE FORM y = a sin x + c
If you cannot view the LiveMath
document below, click here to
troubleshoot.
|
| Question 3: | Is there any difference in the periods of the above graphs?
|
| Question 4: | Graphs B and C are of the form y = sin x + c. Describe how you can
get these two graphs from y = sin x (Graph A).
|
| Question 5: | Graphs D and E are of the form y = a sin x. Describe how you can get
these two graphs from y = sin x (Graph
|
| Question 6: | Graph F is of the form y = a sin x + c. Describe how you can get this
graph from y = sin x (Graph A).
|
C. EXERCISE
| 1. | Do NOT use your computer to do the exercise. You can check your answers after that. |
| 2. | Apply what you have learnt to deduce the shapes of the following curves and sketch them for the domain 0o to 360o inclusive, showing clearly the axes and the crucial points. You are to show intermediate curves using dotted lines. |
| (a) y = 3 sin x (b) y = 2 sin x 1 (c) y = 2 sin x (d) y = sin x + 2 |